Row64 Platform Architecture
Row64’s performance-optimized architecture is fast, precise, and always responsive. Robust APIs and secure deployments make it simple to integrate into any data pipeline.
The Row64 Stack
The Row64 platform is designed for optimal performance, flexibility, and user interactivity.
Row64 Studio
Data prep, geospatial, and spreadsheet-like formula workflows all in a simple drag-and-drop interface, let you quickly build next-generation intelligence that gives you a clear, centralized view of your entire operations.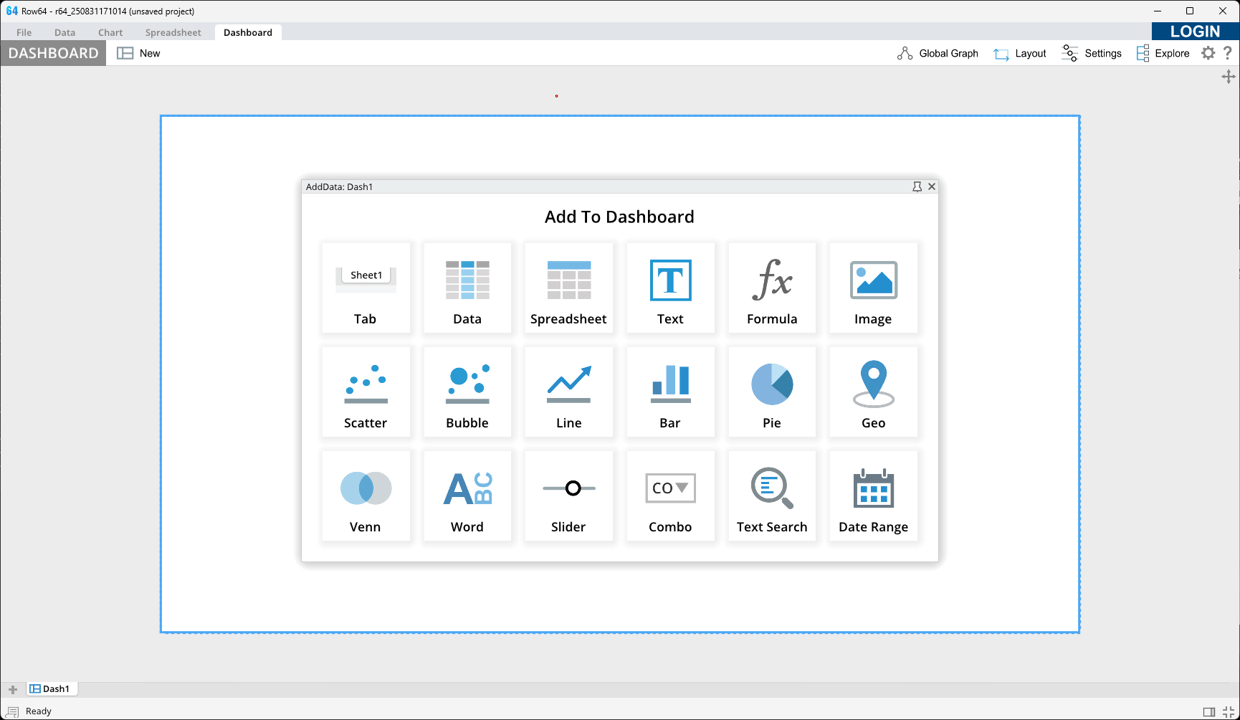
Row64 Dashboard Server
Features hundreds of optimizations that deliver real-time interactivity to an unlimited number of clients for compute-intensive analysis, detailed visualizations, and data driven actions.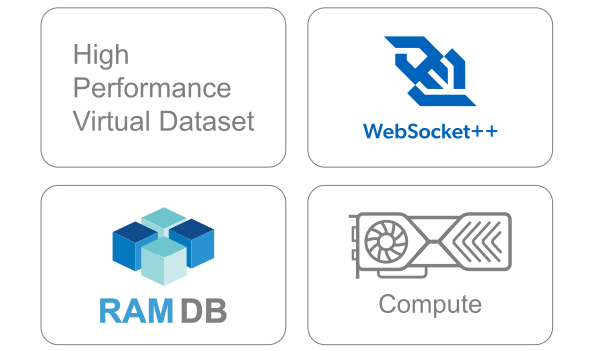
Row64 Streaming Server
Streams live sub-millisecond updates that aggregate with historical warehouse data, making it an ideal insights & monitoring engine for standard (i.e. Apache Kafka) or proprietary streaming pipelines.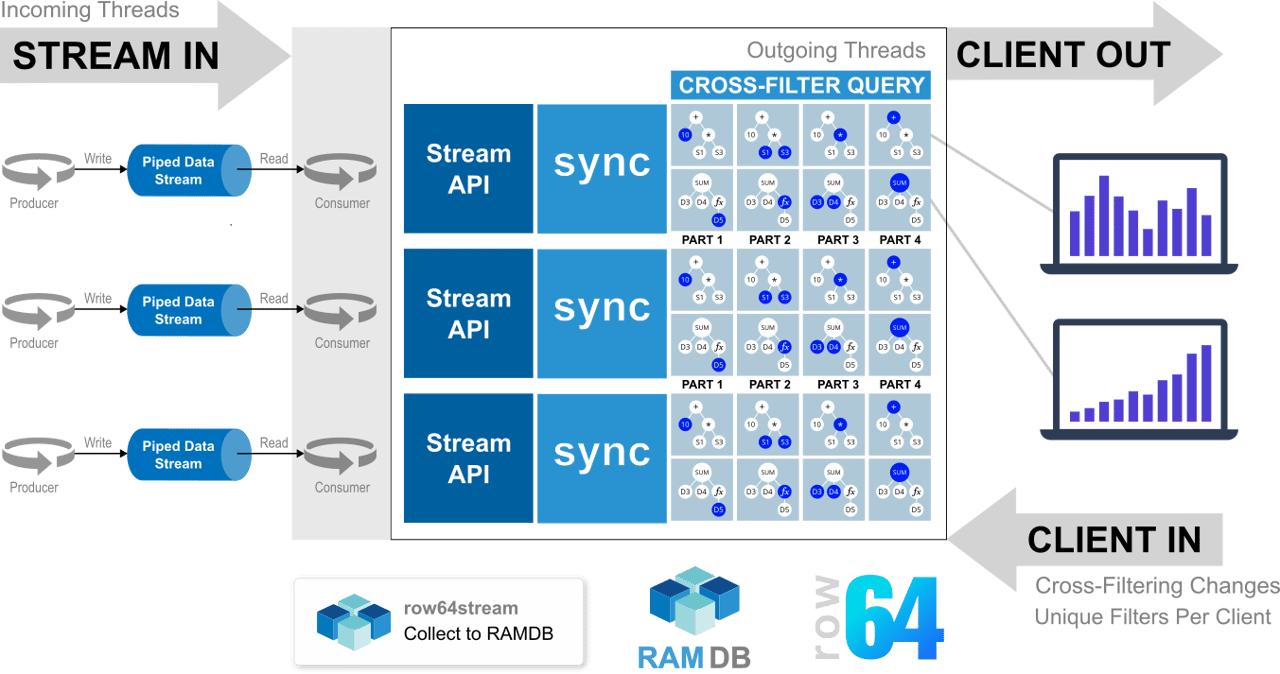
Dashboard Clients
Runs on all popular browsers and is optimized for visual analytics with spatial, structured, and unstructured data at a massive scale.
RAMDB
A multi-threaded, GPU-optimized database handles structured and unstructured relational data.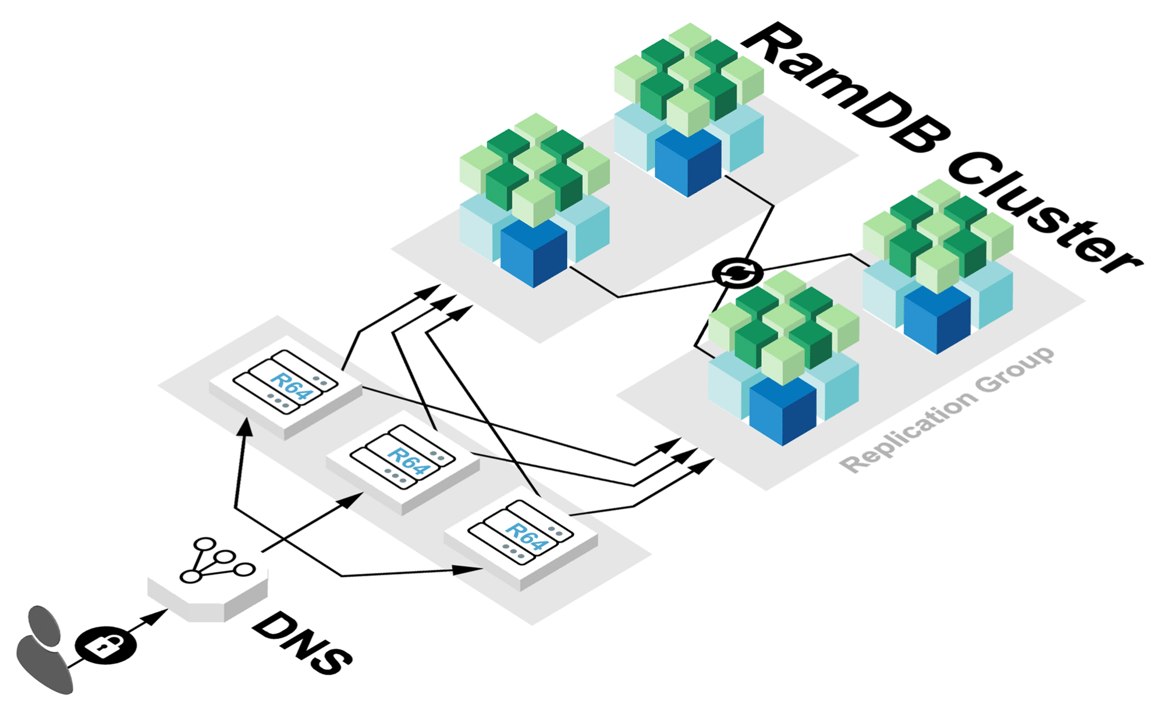
A Robust Set of Connectors
Data APIs
Manage Row64's data connections with Python and high-speed C++ APIs.
GIS Connector APIs
Read mapping, CAD, doc, and media files with Python, JavaScript, and C++ APIs.
Streaming API's
Support high-level streaming protocols down to low-level device protocols for IOT and AMI.
Pop Up Web Apps
Visualize multiple file formats with React, Angular, and JavaScript APIs.
Technology Partners
We're proud to collaborate with some of the biggest and best players in the game. Here are a few of the companies we work with.